Thursday, April 30, 2015

Week 2015/04/27 - 2015/04/30

Weekly report

What we did

  • Wrote a shell script to automate diagram generation from AMZ files.
  • Meet our Chalmers supervisor.
  • Contacted other thesis students to attend their presentation. (June 8th)
  • Registered for mandatory seminar. (May 12th)
  • Read on UML component diagram standards.
  • Finalized our planning report.
  • Gathered preliminary ideas on diagram improvements.
  • Researched papers on the topic of "component placement".
  • Read Graphviz documentation to get familiar with the tools and options : dot, neato, smyrna, lefty, dotty and Cgraph.
  • Read the research paper and placement algorithm on which graphviz dot is based.

Next week's goals

  • Continue gathering information about component placement algorithms and graph generation tools.
  • Start playing around with graphviz librairy.
  • Fix the planning report if it needs it.
  • Read up on what is "human readable", "what is a useful and readable diagram", "what factors are important and ease readability". Possibly contact experts in this domain.


A Technique for Drawing Directed Graphs


Summary of the document : A Technique for Drawing Directed Graphs 


The goal of this paper is having high-quality directed graphs in a quickly way. These four phases describes the algorithm that draws directed graphs.
  1. Placing nodes in discrete ranks 
  2. Ordering nodes within ranks to reduce crossings 
  3. Finding optimal coordinates for nodes 
  4. Making splines to draw edges

There are some aesthetic principles that they want to follow as much as possible:

  1. Expose hierarchical structure in the graph
  2. Avoid visual perversions like edge crossing and sharp bends.
  3. Keep edges short
  4. Favor symmetry and balance

And also for making optimal rank assignment:

  1. Making the graph acyclic: Breaking cycles by reversing certain edges which is based on depth- first search.
  2. Problem definition:  To make short edges, according to aesthetic principle 3, it is needed to find an optimal node ranking.  
  3. Network simplex:  They described a simple approach to the problem based on network simplex formulation.

Link to the documentation: http://www.graphviz.org/Documentation/TSE93.pdf


Graphviz - Smyrna : Graph visualization application

Smyrna is an application for viewing graphs.
Users can open a window on a graph, navigate  around the graph (pan and zoom), select nodes and edge with the mouse.

Work for graphs up till 100 000 nodes.

Visualization modes : 2D, 3D, topological fisheye. The fisheye mode is especially useful for large graphs. It allows users to see an area of interest more clearly.

Smyrna also proposes tools to write queries (count nodes,...), modify the graph and create new graphs.

It can be an interesting tool to give the users a chance to improve the diagrams manually and make changes where the auto-generation tool failed.

Link to documentation : http://www.graphviz.org/pdf/smyrna.pdfa

Wednesday, April 29, 2015

Graphviz - Dot Guide

Summary of the document : Dot Guide - Graphviz

Graphviz is an open source solution to generate graphs from code. Here is a short summary of how the algorithm works and what is possible to do with it.

Component placement algorithm


The Dot component placement algorithm can be decomposed into five phases :
  • Step 1 : Break all cycles by reversing some edge directions within cycles.
  • Step 2 : Assign each node a rank level. This will determine the Y coordinates in a top to bottom drawing.
  • Step 3 : Avoid crossings by rearranging nodes within ranks.
  • Step 4 : Set X coordinates to keep edges short.
  • Step 5 : Route edge splines.
This strategy is based on the work of Warfiel, Carpano and Surgiyama. See references below.

Dot tips and tricks - Layout

List of dot tips and tricks to customize and influence component placement in a graph.
  • The ranks determine the nodes Y coordinates.
  • 'Nodesep' and 'ranksep' attributes influence distances between nodes. 'Nodesep' acts on distances between two adjacent nodes within the same rank (horizontal) whereas 'ranksep' acts on distances between nodes of different ranks (vertical). p12
  • 'Rankdir' attribute allows us to change the positioning from TopBottom to LeftRight (usefull when drawing timelines). p14
  • Influence node ranks with attributes like 'rank' = same, min, source, max and sink. p15
  • Influence edge weight : the heavier is an edge weight, the closer the node will be from each other. p15
  • Group nodes together ('group') : It will keep edges as straight as possible and avoid crossings within the group.
  • Node ports : define where the edge should land on a node. p18
  • Clusters : define subgraphs in their own rectangle area. Possible to fill the rectangle with color for clarity. p19
  • Concentrators : allow a technique of edge merging which can be useful in a dense layout. p24

Dot tips and tricks - Design

  • Change node shape. p4
  • Customize node labels. p6
  • Edge label : add a line to link which label belongs to which edge - decorate attribute. p8
  • Edge label : change the label orientation/distance with 'labelangle' and 'labeldistance' attributes. p8
  • Change node color. p9

Link to Dot Guide


Papers to read later

M. Carpano. Automatic display of hierarchized graphs for computer aided decision analysis.
IEEE Transactions on Software Engineering, SE-12(4):538–546, April 1980.Emden R. Gansner, Eleftherios Koutsofios, Stephen C. North, and Kiem-Phong Vo. A Technique for Drawing Directed Graphs. IEEE Trans. Sofware Eng., 19(3):214–230, May 1993.
[New89] Frances J. Newbery. Edge Concentration: A Method for Clustering Directed Graphs. In 2nd International Workshop on Software Configuration Management, pages 76–85, October 1989. Published as ACM SIGSOFT Software Engineering Notes, vol. 17, no. 7, Novem-ber 1989.
[Nor92] Stephen C. North. Neato User’s Guide. Technical Report 59113-921014-14TM, AT&T Bell Laboratories, Murray Hill, NJ, 1992.
[STT81] K. Sugiyama, S. Tagawa, and M. Toda. Methods for Visual Understanding of Hierarchical System Structures. IEEE Transactions on Systems, Man, and Cybernetics, SMC-11(2):109–125, February 1981.
[War77] John Warfield. Crossing Theory and Hierarchy Mapping. IEEE Transactions on Systems, Man, and Cybernetics, SMC-7(7):505–523, July 1977.

Tuesday, April 28, 2015

Chalmers supervisor meeting

First meeting with our thesis supervisor at Chalmers (Rogardt).

Meeting notes

  • Introduction and presentation of ourselves
  • Overview of the project - what it is about - not an easy project
  • Rogardt mailed one of his contact, a specialist in the area, Leon Moonen, to get his thoughts about the project.
  • Rogardt asked to meet our supervisor at Ericsson - send mail.
  • Planning report draft to be sent for review after the meeting.

Tips from Rogardt 

Look at the Models conference papers about component placements. This shall help us to get familiar with the research which has been done in this area.

Monday, April 27, 2015

References


This post will list the resources that we have used during our thesis.
  1. YAML :http://yaml.org/ Accessed: 12.3.201. AMZ is based on this format. Used to understand AMZ syntax.
  2. Salome Maro, 2014. A DSL Supporting Textual and Graphical Views,University of Gothenburg, Chalmers University of Technology, Department of Computer Science and Engineering, Gothenburg, Sweden. Used for background study on automatic UML generation
  3. Ralf Kollmann ,Martin Gogolla,2002.Metric-Based Selective Representation of UML Diagrams,University of Bremen ,Department of Computer Science, Bremen. Used for background study on automatic UML generation.
  4. Hauke Fuhrmann, Reinhard von Hanxleden, 2010.Taming Graphical Modeling, Real-Time and Embedded Systems Group, Department of Computer Science, Kiel, Germany. Used for background study on automatic UML generation.
  5. PlantUML :http://plantuml.sourceforge.net/ Accessed: 13.3.2015.
  6. GraphViz :http://www.graphviz.org/ Accessed : 13.3.2015.
  7. TextUML :http://abstratt.github.io/textuml/readme.html Accessed : 13.3.2015.
  8. yUML :http://yuml.me/ Accessed : 13.3.2015. 
  9. Umple :http://cruise.eecs.uottawa.ca/umple/ Accessed : 13.3.2015 
  10. Martin Mazanec, Ondrej Macek, 2012. On General-purpose Textual Modeling Languages, Department of Computer Science, FEL, Czech Technical University, Praha, Czech Republic.
  11. UML standards https://www.ibm.com/developerworks/rational/library/dec04/bell/ Accessed : 27.04.2015.
  12. GraphViz Dot Guide : http://www.graphviz.org/pdf/dotguide.pdf - see post : http://betterumldiagrams.blogspot.se/2015/04/graphviz-dot-guide.html.

Week 1 : 2015/04/23 - 2015/04/24

The first week was really short, only two days.
We did :
  • Set up our computers
  • Set up git and clone the repository locally
  • Booked an appointment with our Chalmers supervisor
  • Wrote a planning report draft
Next week goals :
  • Finalize the planning report
  • Generate all component diagrams (6-8 files) - Write a bash script to do this automatically.
  • Study the diagrams and together with our supervisor at Ericsson define areas of improvements (specifications) - see previous post for preliminary ideas -
  • Get familiar with AMZ format, PlantUML and Graphviz to see what it is possible to do with these tools. 

Thesis preliminary time plan


Current date: 2015/04/27

Planning report and background study

Planning report draft : 2015/04/24 - 2015/05/01
Planning report meeting with supervisor : 2015/04/27
Planning report final version : 2015/04/27 - 2015/05/04
Planning report due :  2015/05/04
Background research : 2015/04/24 - 2015/05/15

Experimentation - Implementation


Experiment test:   3 weeks.  2015/05/18 - 2015/06/05
Design and implementation of the solution : 4 weeks. 2015/06/08 - 2015/07/03

Integration - Documentation - Finalization

Test and set-up the solution :  3 weeks.  2015/07/06 - 2015/07/24
Documentation for Ericsson : 1 week.  2015/06/27 - 2015/07/31
We are planning on writing our final report continuously and book the last three week for final reviews. 2015/08/03 - 2015/08/21


Opposition dates
To be announced

Problem formulation


As stated in the previous post, the aim of this thesis is to provide an optimized way to generate readable component diagrams from textual models.


The department describes its software models in a self-created language called AMZ (amazon) YAML based. From these files, our solution should generate good-looking and readable diagrams.
The team is currently using PlantUML and is able to generate both component and activity diagrams automatically. Unfortunately, component diagrams are not readable for complex systems. 
There are many lines crossing, long stretches across the drawing area, small text over components,...

Some areas of reflection on diagram generation improvement :   
  • Component positioning  
Refine the set of rules governing component placement.
  • Line crossing avoidance
Refine the set of rules to avoid as much line crossing as possible.
  • Line length minimization
    Refine the set of rules to minimize line length and therefore avoid long stretches across the drawing area.
  • Color coding
Define a color code to group items together visually and make the diagram more readable.
  • Components/interfaces modelization
    Play with different modelization techniques to improve readability. For example, the following component/interface modelization are equivalent.

  • Abstraction level
    Work on proposing different abstraction levels. For example : package level, detail level,...
  • Cardinality factor positioning
    In the auto-generated example, we can see that many cardinality factors are positioned on lines or components. One improvement idea could be to work on a better placement.
  • Ports
Instead of having lines from within a package (over component) going inside another package, we could try to use ports.


This was only a beginning of reflection. Our task is to further investigate how we could improve the diagrams’ readability and implement a solution which suits Ericsson’s needs.


Thesis background

Introduction
Ericsson is a telecommunication company in charge of setting up, developing and maintaining radio antennas linking mobile user devices to the phone operators’ networks/internet.

The DURA department (Development Unit Radio) is developing baseband processing functions for WCDMA (3G) and LTE (4G) in order to build the next generation Multi Standard Radio Base Station.

They currently describe their software system in a textual model written in a language they developed themselves called AMZ (YAML based 1). From this model they are able to generate C code which is the base of their software’s implementation.

As their software system can be quite big and complex, the team also wants to be able to automatically generate nice looking and readable UML graphical models from AMZ files. This will allow both developers and non-developers to more easily understand the system and to save the team time when writing/updating the documentation.

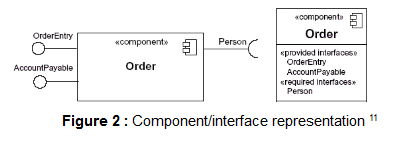
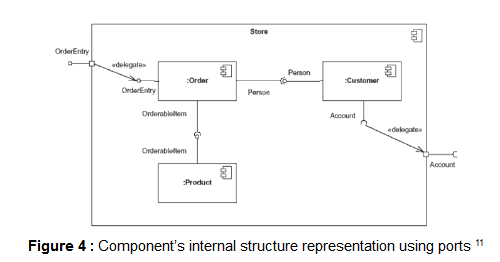
The UML, Unified Modeling Language, defines several kinds of diagrams which can be grouped into three families: Structure diagrams, Behavior diagrams and Interaction diagrams. The team primarily needs to be able to generate Component diagrams (Structure) and Activity diagrams (Behavior).

Component diagrams represent the structure/architecture of a system whereas activity diagrams model the system’s behaviors and its functionalities. (See examples below)

Whereas activity diagrams model the system’s behaviors and its functionalities.(See example below)

So far the team has succeeded in generating activity diagrams by using PlantUML/GraphViz, an open source graph visualization software. However, generating readable component diagrams from AMZ files has been proven to be challenging and has not been solved yet.

Aim of the thesis

The aim of this thesis project is to investigate how to generate readable component diagrams from AMZ files and to implement a solution. Some possible options would be to extend existing open source projects, to further develop AMZ and/or to implement a completely new solution.


Method of accomplishment

We plan to organize our thesis work as follow :
  • Define with the team the project’s specifications and requirements : functions, limitations and performance expectations (running time, memory use).
  • Do a background study and analyze existing UML/ graph visualization solutions. Our aim is to determine if it would be possible to use or extend them to generate readable diagrams for the team’s software system.
  • Study in details the software system specifications as well as AMZ. The goal is to get a good understanding about the system and tools at our disposal to propose the best solution possible.
  • Design and implement our solution. One challenge we will face is to develop a good algorithm which will place dynamically the graphical components in a readable manner.
  • Rassemble test sets : software textual models. Our goal is to cover as many configurations as possible in order to verify that our solution performs well. If not,  take a step back and rethink the solution.
  • Collect test results and analyze them. It will be interesting to see how our solution performs and how it models different software systems.
  • Write the thesis report continuously during the project.

Limitations

  • Ericsson software models : our primary task is to improve component diagrams generation for Ericsson’s department products.
  • Environment : our solution should be integrated in Ericsson’s environment. It is therefore a limitation on the tools we can and cannot use.
  • Time constraint : given the limited amount of time of a thesis work, it is not realistic to think that we will be able to work on all our diagram generation improvement ideas. Instead we should select the best subset possible and focus our efforts on them to deliver a working solution by August.

Presentation

We are two master students currently in their final year at Chalmers University of Technology, Gothenburg, Sweden.
We created this blog to present the progress of our master thesis : Optimizing UML diagram generation for complex systems. The thesis is completed for and at the company Ericsson.
The aim of this blog is to help us track our progress as well as allow our supervisors and examiner to follow our work.

Myriam Economou
Zeynep Gökmen