Friday, May 29, 2015

Week 2015/05/25 - 2015/05/29

Weekly report

What we did

This week was dedicated to report writing.
We had the status report deadline on Thursday and we started to compile our blog posts, notes into our final report draft.
We also experimented with a tool called KIELER to test several layout algorithms.
We also met with our supervisors, phd students and specialists working in this field.

What we will do

  • Complete the first sections of our final report (introduction, background, method, related work, tools).
  • Get familiar with git.
  • Start editing PlantUML source code to use Neato.

Thursday, May 28, 2015

Gephi - Experimentation (part 2)

Here are some results using one of the most complex models we have : RlsSC
(Refer to this article for information on how we generate automatically our graphs)

Original plantUML diagram


Gephi random node placement


Using Force Atlas

Parameters


 Using Fruchterman Reingold

Parameters


Using Yifan Hu

Parameters

Monday, May 25, 2015

Meeting Notes - 2015/05/20


We met our thesis supervisor Rogardt Heldal and Thorbjörn Larsson, our company supervisor at Ericsson. Rogardt also invited his Phd student Ulf Eliasson, who is working on system visualization at Volvo. 
  • Thorbjörn introduced the existing problems of component diagrams and their readability.
  • Rogardt and Ulf mentioned the similarities of the issues we are trying to solve with Ulf's work at Volvo.
  • We showed our experiment results with layout algorithms and tools we have tried and discussed our conclusions and additional ideas we have.
  • Decided to focus on a specific solution for Ericsson rather than working on an universal solution since this problem is a known difficult problem in the field and we have only a very limited amount of time.
  • Rogardt and Ulf suggested us to research circuit drawing algorithms which could give us some more ideas.
  • Decided to meet next week where Rogardt will invite one of his colleagues, who has knowledge in this area.

Week 2015/05/18 - 2015/05/22

Weekly Report

What we did

  • Searched some other tools and analyzed if they are useful.
  • Met our supervisor at Ericsson and discussed about our experiments and ideas on Tuesday.
  • Started reading documentation of Git since we will implement our solution using Git.
  • Met our both supervisors from Ericsson and  Chalmers also with a Phd student Ulf Eliasson (see our meeting notes) on Wednesday
  • Decided to meet next week with supervisors after meeting

Next week's goals

  • Meeting with supervisors
  • Send status report to our examiner
  • Write final report draft
  • Get familiar with Git system to modify PlantUML source code and play around with our ideas.

Monday, May 18, 2015

Graph Drawing with Neato


Neato is a program part of the Graphviz suite which generates undirected graphs. It uses a spring model as its layout strategy i.e an ideal spring is placed between every pair of nodes. The springs then pushes the nodes so that their geometric distance approximates their path distance in the graph.
We ran a serie of experiments to see if the produced layouts match PlantUML layouts or if it increases/decreases readability.
Here are some of the results we obtained :

Figure -1 Diagram A generated with PlantUML


Figure - 2 Diagram A generated with Neato

As you can see, neaoto's layout doesn't match the PlantUML output which is a surprise as PlantUML uses Graphviz to generate its diagrams and Neato is the 'undirected graph' module. Instead of having a quite linear graph like with PlantUML, Neato diagram occupies the space more homogeneously and produces a more readable layout. 
We then experimented with some more complex diagrams. The readability was still much better than with PlantUML.


Figure - 3 Diagram B generated with PlantUML

Figure -4 Diagram B generated with Neato

Thoughts

Knowing that PlantUML uses Graphviz as a basis, it should be possible to switch its layout algorithm to Neato without too much difficulties.
Even though Neato's layout algorithm produces more readable diagrams, a problem to address is the amount of component/edge on the view. When the diagram gets complex there is too much things going on and it is difficult for the human eye to understand what it is all about. It feels like it is not enough to work only on layout strategies, we should work on refactoring the diagram structure as well.

Link to the documentation : http://www.graphviz.org/pdf/neatoguide.pdf

Monday, May 11, 2015

Week 2015/05/04 - 2015/05/08

Weekly report

What we did

  • Researched information of layout algorithms
  • Researched tools for trying different layout algorithms
  • Installed and tried out Tulip  (article)
  • Installed ad tried out Gephi  (article coming).
  • Wrote automation script for Gephi graph structure generation
  • Wrote obfuscation script to generate publishable models from Ericsson's models

What we will do (3 days week)
  • Mandatory seminar on Tuesday afternoon
  • Prepare CV and cover letter for seminar
  • Publish Gephi and Tulip experimentation results
  • Try Neato (Graphviz)

Friday, May 8, 2015

Comparison of Generated Diagrams with Graphviz and Tulip

Comparison of Diagrams

Tulip is another data visualization tool which offers big range of layout algorithms for presentation of diagrams.
 
When we compare Graphviz  and Tulip diagram generations, it is very obvious to see that applying different algorithms with Tulip to the given Graphviz generated graphs, improves the readability of   the diagrams. We applied "Tree Leaf" algorithm, which we think is the best one to use when generating crossing-free and aesthetically pleasing diagrams. See examples in Figure 1-4 for  some complex representations.

Figure 1- Given diagram A


  Figure 2- Algorithm applied to Diagram A


Figure 3- Given diagram B 

  Figure 4- Algorithm applied to Diagram B

 Link to Tulip homepage : http://tulip.labri.fr/TulipDrupal/

Thursday, May 7, 2015

Layout Methods For Graph Drawing

Graph Layout Algorithm List

The purpose of these  methods is placing nodes in two or three dimensional space to have crossing-free and aesthetically pleasing diagrams as much as possible. 
  1. Force-directed Layout Methods: 

    These algorithms assign forces to all nodes and edges of the graph. For example in equilibrium state, the edges tend to have almost same length and the nodes that are not connected tend to be placed far apart from each other.

     Figure-1 Force-directed layout(1)

    Graph drawing software like Gephi, Grapviz and Tulip give opportunity to their users to apply force-directed layout methods to the graphs.
  2. Layered Graph Drawing:

    This method is also known as Sugiyama-style graph drawing after Kozo Sugiyama who introduced this algorithm for the first time. It follows hierarchical way to draw directed graphs where nodes of the graph are placed in horizontal layers and edges tend to be straight and directed downwards.

    Figure-2 Layered drawing of a directed acyclic graph(2)

  3. Orthogonal Layout Methods:

    The graphs drawn by this method, have horizontal or vertical edges which are parallel to the the axes of the layout.

    Figure-3 Orthogonal layout (3)

  4. Arc Diagrams:

    Arc diagrams' nodes are placed on a line and edges are drawn in a semi-circular form.

    Figure-4 An arc diagram (4)

  5. Dominance Drawing: 

    It is a drawing style for directed acyclic graphs that provides reachability relations between nodes.
     Figure-5 Dominance Drawing (5)

  6. Tree Layout Algorithms:  

    The algorithms draw graphs in a rooted tree-like format. "Balloon layout" is one of the tree layout algorithms, where children of each node form a circle around the node.

    Figure-6 Tree layout (6)


    Figure-7 Balloon layout (6)

    References:

    1. http://www.eulerdiagrams.com/tutorial/AutomatedDiagramDrawing.html  
    2. http://en.wikipedia.org/wiki/Layered_graph_drawing 
    3. http://ux.stackexchange.com/questions/19163/are-network-components-good-ux
    4. http://en.wikipedia.org/wiki/Arc_diagram 
    5. http://en.wikipedia.org/wiki/Dominance_drawing
    6. http://www.infiview.com/dev/kb/layouts.html    
              All accessed: 2015/05/07     

Gephi - Interactive graph visualization platform

(Article to be extended when we have experimented more)

Gephi is an open-source graph visualization interactive platform.
Runs on Windows, Mac OS X, Linux.
Free.

Features

  • Real-time visualization
  • Layout algorithms
  • Metrics
  • Dynamic network analysis
  • Cartography creation
  • Clustering and hierarchical graphs
  • Dynamic filtering
  • User-centric

Screenshots


Layout algorithms

  • Force Atlas
  • Force Altlas 2
  • Fruchterman Reingold
  • Yihan Hu
  • Yihan Hu Proportional
  • Yihan Hu's Multilevel

How does it work

The first step is to define the graph structure. Gephi developpers created their own format based on XML (GEXF) but it is also possible to import graph data via CSV, Dot (Graphviz), GML and GDF files.
When the graph structure is created, we can import it in Gephi and start applying different layout algorithms, change the design, node/edge positions,...
We can export the graph in pdf, png, svg files as well as csv.

Why is it relevant

What interested us mostly with Gephi was the possibility of running different layout algorithms and parametrize them. We ran some experimentation to see how they perform on our models and which parameters are the best. (refer to layout algorithms list article)

Gephi limitations

  • It is not possible to change the nodes' shape.
  • Unsure if graph export can be made from command line.

Experimentation

Generate graph structure files (Gexf)
To avoid doing it manually  - wrote Python script converting the team models to gexf files.
As it was not possible to change the nodes shape, we used different colors to differentiate components from ports. (/home/emyreco/tests/python/makeGephi.py)

Original plantUML diagram


Example of random placement


After applying Force Atlas
  • Parameters


After applying Fruchterman-Reingold:
  • Parameters
  • Area : 10000
  • Gravity : 10
  • Speed : 1

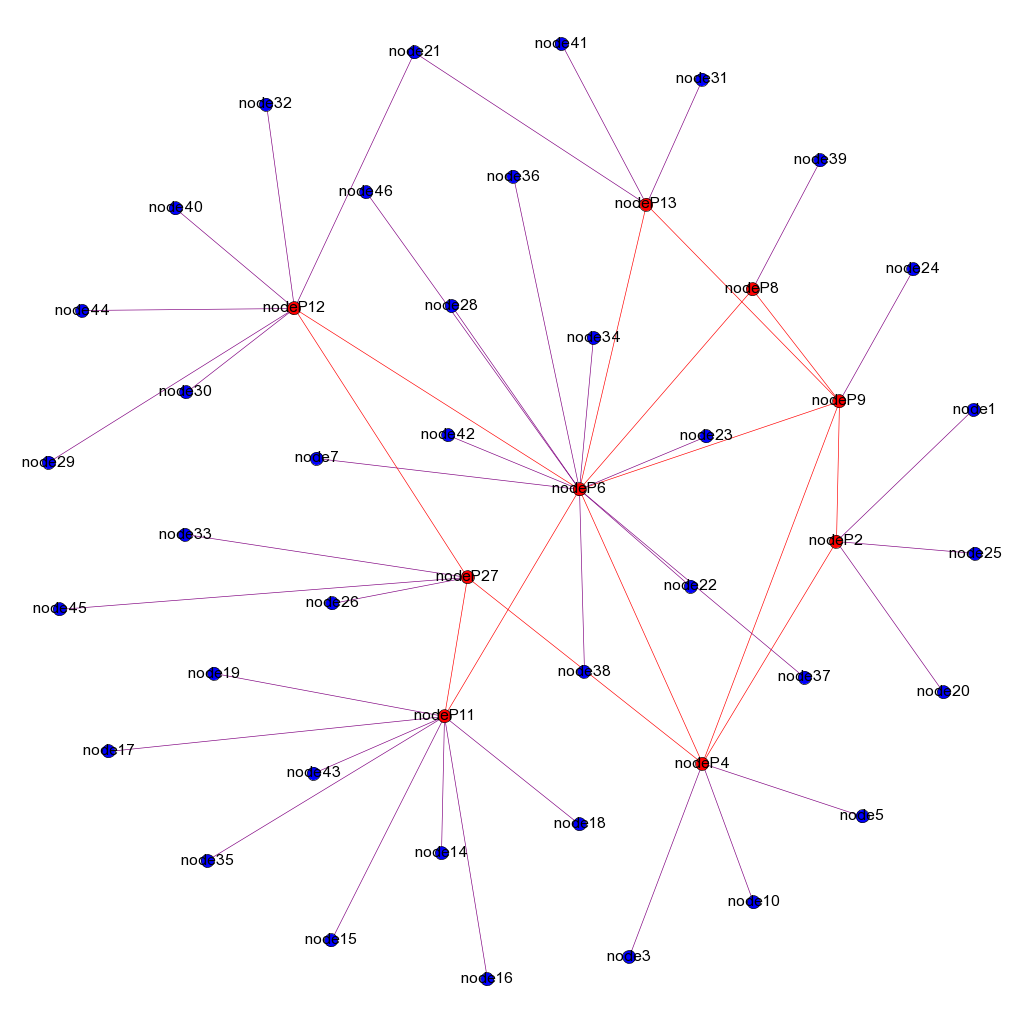
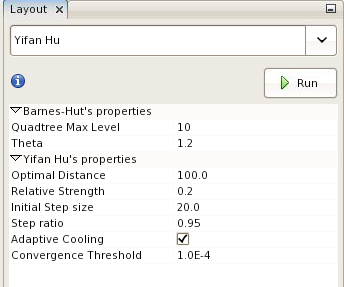
After applying Yihan Hu:
  • Parameters 


Preliminary results

The layout obtained by the Force Atlas algorithm increased drastically readability. It was not clear on the plantUML diagram that we were dealing with three independent entities whereas on the Force Atlas graph is it what pops up directly.
Yihan Hu also makes it obvious that the graph is composed of independent entities but the labels are hardly readable.
Finally the Fruchtermann algorithm didn't seem to improve readability much.
We need to play around more with the algorithms' parameters to see how we can improve readability for our models even more. This will give us ideas on how to design our final solution.

More experimentation results in following articles.


Tuesday, May 5, 2015

Extending the Sugiyama Algorithm for Drawing UML Class Diagrams

Summary of the Document:

Extending the Sugiyama Algorithm for Drawing UML Class Diagrams: Towards Automatic Layout of Object-Oriented Software Diagrams

Paper by  Jochen Seemann

In this paper he presents a technique for  the automatic layout of UML class diagrams.
The algorithm consists of four stages:
  1. Preparation : Remove direct cycles from the given graph and compute the subgraph that contains only classes with inheritance relations. The subgraph is a directed acyclic graph.
  2. Sugiyama Layout: Compute a first layering for the subgraph according to nodes inheritance relationships. Reduce the number of crossing by using barycentric ordering.
  3. Incremental Extension: Extend the layout incrementally, until all nodes have been placed in the diagram. Optimize the position of nodes in  each layer to reduce the number of  line crossings which also improves the aspect ratio of the diagram.
  4. Orthogonal Drawing of Association Connection Edges: Sweep line algorithm is used when computing line segment positions of association relationships between classes on the same or adjacent layer.
 
Figure- Optimization using sublayers

 Link to the paper: http://citeseerx.ist.psu.edu/viewdoc/download?doi=10.1.1.52.8447&rep=rep1&type=pdf


Monday, May 4, 2015

Visualization of Structural Information: Automatic Drawing of Compound Digraphs


Summary of the Document:
Visualization of Structural Information: Automatic Drawing of Compound Digraphs
(Paper by Kozo Sugiyama and Kazuo Misue)

They suggested an effective algorithm that draws compound digraphs automatically. Both inclusion and adjacency edges are considered in the method.

Class of  Graphs p2
 Inclusion Digraph: D = (V, E) where E is a finite set of inclusion edges whose element (u, v) E means that u includes v.

Adjacent Digraph: D = (V, F) where F is a finite set of adjacency edges whose element (u, v)
  F means that u is adjacent to v
Readability Elements p2
  1. Drawing Conventions: Fundamental constraints(necessary)
    • Rectangle: A vertex is drawn as a rectangle
    • Inclusive: If the graph is inclusion, that should be shown geometrically in the digraph, if not edges should be disjoint.
    • Hierarchical: Vertices should be placed according to their relations(inclusion and adjacency)
    • Down arrow: An adjacency edge (u,v) is drawn as downward arrow
  2. Drawing Rules: Objectives satisfied as much as possible.
    • Closeness: Connected vertices placed as closely as possible
    • Line- crossing: Reducing the number of crossing between adjacency edges as much as possible
    • Line-rect-crossing: Reducing  the number of crossing between adjacency edges and rectangles as much as possible
    • Line straightness: Close adjacency edges are drawn as straight lines and far ones are drawn as polygonal lines while reducing number of bends and increasing the length of vertical part of the lines as much as possible
    • Balancing: Placing  edges terminating and originating from a vertex in a balanced form
 Steps of the Algorithm p3
 Algorithm consists of 4 steps:
  1. Hierarchization: First, checking for possibility of hierarchy when compound digraph is given. If there is no possibility, they determine reversed adjacency edges to assign compound level to each vertex and obtain an assigned compound diagram. But finding minimum edge set is NP-complete. So they used heuristic methods instead.
  2. Normalization: An assigned compound digraph is converted to a proper compound digraph
  3. Vertex ordering: In each local hierarchy, horizontal orders of vertices are determined to obtain Closeness, Line-crossing, and Line-rect-crossing rules as much as possible. Minimizing line-crossing and minimizing line-rect-crossing are NP-complete. Therefore they introduce heuristics for this problem.
  4. Metrical layout: Horizontal positions of vertices are defined by applying Closeness, Line-straightness and Balancing rules as much as possible.